


You logged into Google Search Console, and there it was: a red label, a failed status, and a score that looks far worse than you expected. If your Core Web Vitals assessment failed, Google is telling you that real users are experiencing slow loading times, layout shifts, or delayed interactions.
Those issues push visitors to leave before taking action, which can reduce enquiries, sales, and other conversions. Google also uses Core Web Vitals as a ranking signal, so persistent problems can make it harder for your pages to compete in search results.
The good news is that every failure has a cause, and every cause has a fix. In this guide, we’ll explain the three Core Web Vitals metrics, why they fail, and how to fix the problems behind them.
Let’s get started.
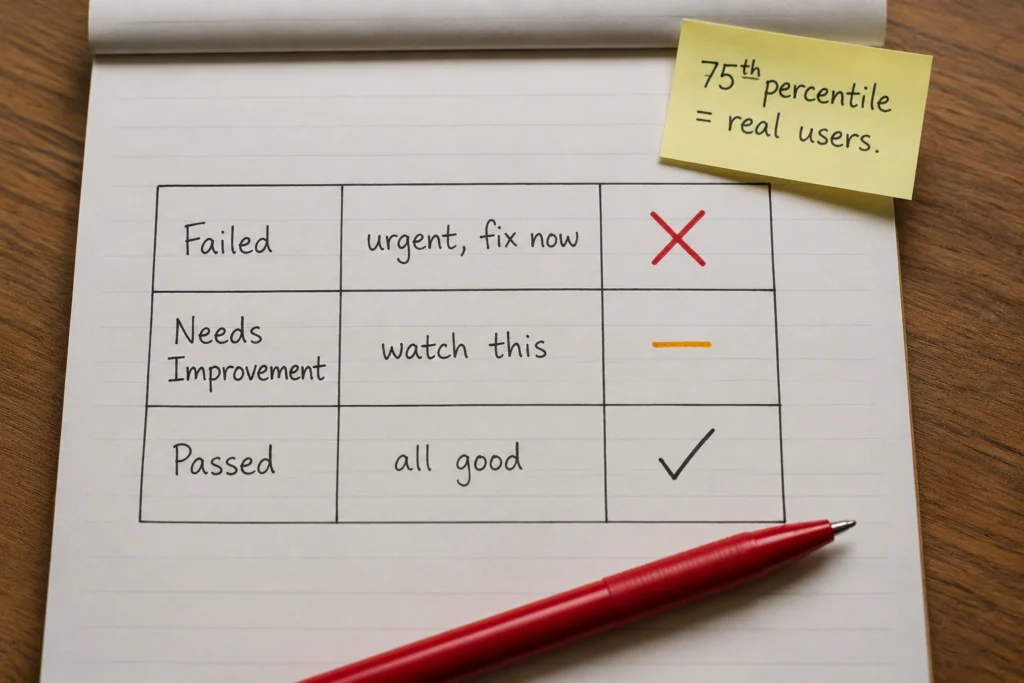
When you see a “Failed” status in your Core Web Vitals report, it means your page isn’t meeting Google’s performance standards at the 75th percentile of visits. That threshold is based on field data collected from people browsing your site. The report also shows two other statuses, which give you three possible outcomes:
You’ll find this in Google Search Console under the “Core Web Vitals” section. One other tool you can use is PageSpeed Insights. It provides a snapshot of your page performance using simulated data. But since it relies on lab data rather than field data, the results won’t always match what you see in Search Console.
You may also come across an “Insufficient Data” message. This simply means Google hasn’t collected enough real-user visits for that URL yet to determine whether it has passed or failed.
The question many people ask is, “What are Google’s Core Web Vitals?” They are three user-centric metrics that measure how your page performs from a visitor’s perspective. Here’s what each metric measures and the threshold it needs to hit:
| Metric | What It Measures | Pass Threshold |
| LCP (Largest Contentful Paint) | Loading performance of the largest visible element | Under 2.5 seconds |
| INP (Interaction to Next Paint) | Page responsiveness to user interactions | Under 200 milliseconds |
| CLS (Cumulative Layout Shift) | Visual stability as the page loads | Under 0.1 |
Source: web.dev/articles/vitals
A page that fails even one of these metrics will show a failed Core Web Vitals assessment, regardless of how well the other two perform. That’s worth keeping in mind when you’re diagnosing which metric is behind your result.
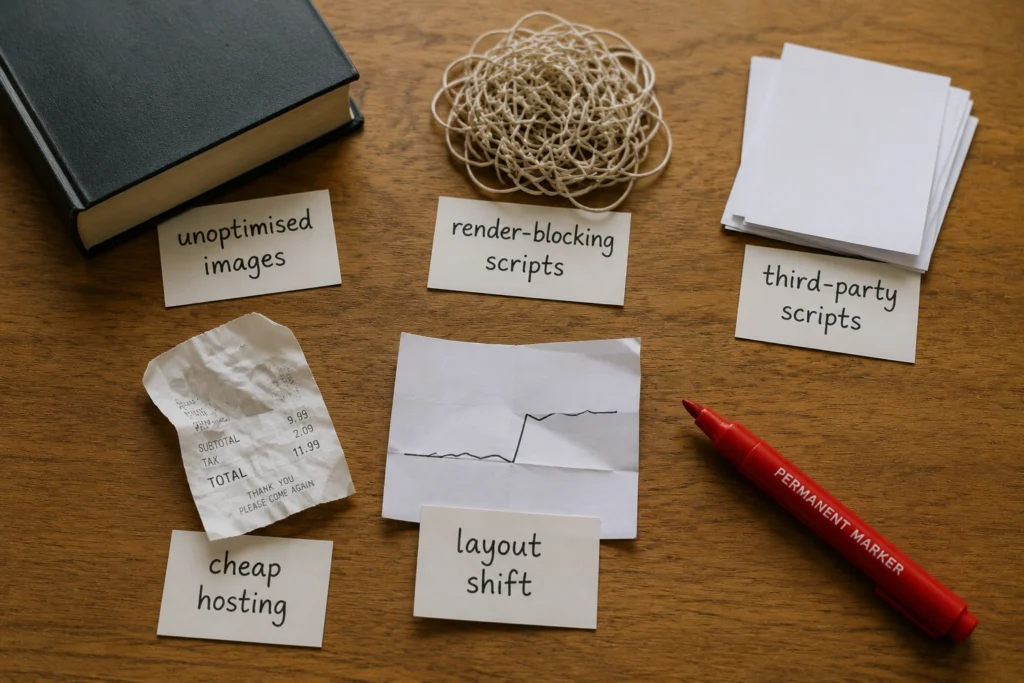
Most failed assessments can be traced to a few recurring problems. We’ve grouped each one by the metric it affects, so you can quickly find the fix that applies to your site.
Most of the sites we audit have at least two or three of these issues at the same time. Fortunately, fixing the biggest performance bottleneck first leads to a clear improvement in your overall Core Web Vitals score.
The most reliable ways to improve core web vitals depend on which metric failed. Check your Search Console report or PageSpeed Insights to see which of the three is in the red, then work from there. Below, we’ll walk through exactly how to fix each issue.

LCP is usually the most impactful to fix because it directly affects how fast your page feels.
Start with your hosting. If you’re on shared hosting with slow response times, moving to a faster server or adding a CDN (Content Delivery Network) can cut seconds off your LCP on its own. A CDN serves your content from a location closer to your visitor, so the distance the data travels is shorter.
Next, look at your images. Compress them, serve them in WebP format if you can, and make sure you’re not loading a 1500px wide image into a 400px container. Tools like Squoosh or ShortPixel handle this well. If the LCP element is an image, also consider adding a preload tag for it so the browser fetches it early instead of discovering it late.
Finally, audit your render-blocking resources. Defer non-critical JavaScript and load CSS efficiently. Your developer or a plugin like WP Rocket (if you’re on WordPress) can handle most of this without touching code manually.
INP is the newest of the three metrics and the trickiest to diagnose. But the causes are usually rooted in the same place: too much JavaScript doing too much work when a user interacts with the page.
The first thing to look at is whether any scripts can be deferred or loaded asynchronously. Scripts that run on page load compete with user interactions for the browser’s attention.
This is where long tasks become a problem. These are chunks of JavaScript that run for more than 50ms without a break, and during that time, the browser can’t respond to clicks or taps. Breaking those tasks into smaller pieces gives the browser room to respond between interactions.
Third-party scripts are often the hidden culprit here, too. A chat widget that fires up a dozen network requests on load can cause noticeable interaction delays. Auditing what’s necessary and loading non-essential scripts after the page is interactive usually resolves the worst of it.
CLS failures almost always come down to elements that load late and push things around when they arrive.
The simplest fix is to always define width and height attributes on your images and video embeds. When the browser knows the dimensions upfront, it reserves that space in the layout before the image loads. Without those attributes, the image loads in and shoves everything below it downward.
Dynamic content injected above existing content is another common cause. Banners, cookie notices, or personalised content that appears after the initial render can all shift the layout. If something needs to appear at the top of the page, reserve the space for it from the start.
Web fonts can also trigger layout shifts if they load late and swap with a fallback font that’s a different size. Using font-display: swap helps, but pairing it with preloading your key fonts is the more complete fix. That way, the font loads early enough that the swap happens before the user sees the page.

Once you’ve made your changes, you’ll want to verify they’re working. Start with a fresh Core Web Vitals analysis in PageSpeed Insights. It gives you immediate feedback based on lab data so you can see whether the numbers are moving in the right direction.
For real-user data, you’ll need to wait. Google Search Console updates on a 28-day rolling window, which means it takes weeks for enough new visit data to replace the old. Don’t panic if Search Console still shows “Failed” the day after your fixes (that’s expected).
The Chrome User Experience Report (CrUX) is another useful source. It’s the same real-user dataset that feeds Search Console. You can also query it through PageSpeed Insights to get a clearer picture of how your pages perform for actual visitors over time.
To track progress properly, give the changes time to reflect in real-user data. Set a reminder to recheck Search Console three to four weeks after your fixes. That’s usually when you’ll start seeing the status shift.
Working through Core Web Vitals issues takes some patience, but the path is clear. You identify which metric failed, trace it back to a cause, apply the right fix, and then give it time to reflect in the data.
If you’re still not sure how to improve Core Web Vitals on your specific site, it might be time to get a second set of eyes on it. The same applies if you’ve made changes and the scores aren’t moving. The DevelopersDex team works with sites of all sizes to diagnose and fix exactly these kinds of performance issues.
Get in touch with our team today.
Company Reviews